Trend
Plot a tag's value over a rolling window of time.
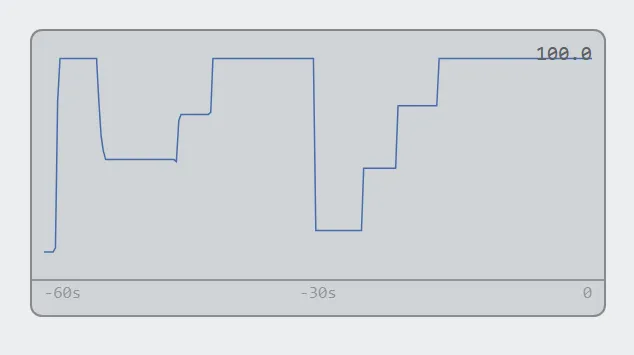
A 60-second window. The axis counts backwards from now, which is the right-hand edge.
A trend plots one numeric tag against time, over a rolling window. It answers the question a Gauge cannot: not what the value is, but where it has been — whether it is drifting, cycling, or holding steady.
The window is fixed by the design, and history older than it scrolls off. Nothing is stored on the controller, so a trend starts empty when the screen opens and fills from the right as time passes.
The horizontal axis is labeled in seconds before now, so 0 is the current
moment at the right-hand edge.
Adding the control
Section titled “Adding the control”- Open the document and select the screen you want from the screen tabs.
- In the control palette, press Trend and drag it onto the canvas.
- Bind it to a numeric tag and set the window length.
Properties
Section titled “Properties”| Property | Description | Default |
|---|---|---|
| Tag | The value to plot. | none |
| Title | Heading on the plot. | none |
| Time window | Length of the window, in seconds. | 60 |
| Min / Max | Fixed ends for the vertical scale. Leave empty to fit the data. | auto |
| Show value | Display the current value alongside the plot. | on |
| Decimals | Digits after the decimal point in the readout. | 1 |
| Unit | Suffix shown after the value. | none |
| Size | Text size in pixels. | 12 |
| Line / Fill / Background / Text colors | Appearance. | theme tokens |
Leaving Min and Max empty scales the plot to whatever it has seen, so the line always fills the height — which makes small variation look dramatic. Fixing both scales the plot to the range that matters instead.