Gauge
Display a numeric value against a range.
CONTROLREQUIRES A TAG
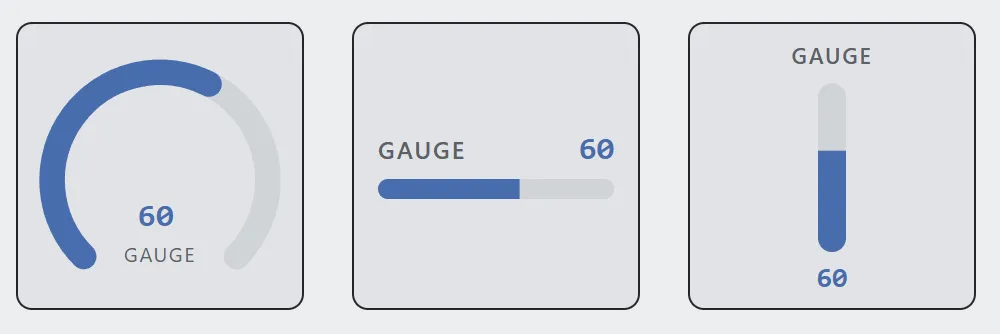
The three appearances, each showing the same value: arc, horizontal bar, vertical bar.
A gauge displays one numeric tag against a fixed range, changing color at any thresholds you set.
It reads the tag and never writes to it.
Adding the control
Section titled “Adding the control”- Open the document and select the screen you want from the screen tabs.
- In the control palette, press Gauge and drag it onto the canvas.
- Bind it to a tag, then set the range that tag actually moves through.
Properties
Section titled “Properties”| Property | Description | Default |
|---|---|---|
| Tag | The value to display. | none |
| Title | Label above the value. | Gauge |
| Unit | Suffix shown after the number. | none |
| Min / Max | The ends of the range. | 0 / 100 |
| Decimals | Digits after the decimal point. | 0 |
| Appearance | Arc, horizontal bar, or vertical bar. | arc |
| Color | Fill color below the first threshold. | primary |
| Thresholds | Values at which the fill changes color. | 75 warning, 90 error |
| Background / Track / Value / Title colors | Individual overrides. | theme tokens |
Thresholds
Section titled “Thresholds”A threshold is a value and a color: at or above that value, the fill takes that color. They arrive set to amber at 75 and red at 90.